Level
There are more than a hundred of different strategies for forex trading. Some of them are using graphical models on the chart, other – indicators, and others – candlestick analysis and so on. There are mixed strategies, which works using a few of the different instruments in their algorithm. But there are also quite simple and, at the same time, profitable strategies, understandable by even a novice traders. We propose three of them below.
Today, we examine one of the most simple strategies based on candlestick analysis, which was called Trend Reversal. The strategy most often used for intraday trading for the purpose of profit making during the trading session. To do this, we will follow H4 timeframe of USDCHF currency pair on MetaTrader terminal.
Learn how to use MetaTrader 5 in our guide.
The strategy is based on the fact that any movement is never infinite. If the price for a few days is moving one direction, someday it will go the other. That is, if we get bullish candles a few days, it is necessary to wait for a day when longest bearish candle is formed on the chart that its range may engulf some of the previous candles, or, at least, the range of the previous day.
This candle can indicate a trend reversal, which, incidentally, happens not so often or at least a correction to the previous movement. The same situation may be on the bearish trend, when amid the decline, one day gives a sharp rise and draws large bullish candle. We picked up a graph you can see two signals at once.
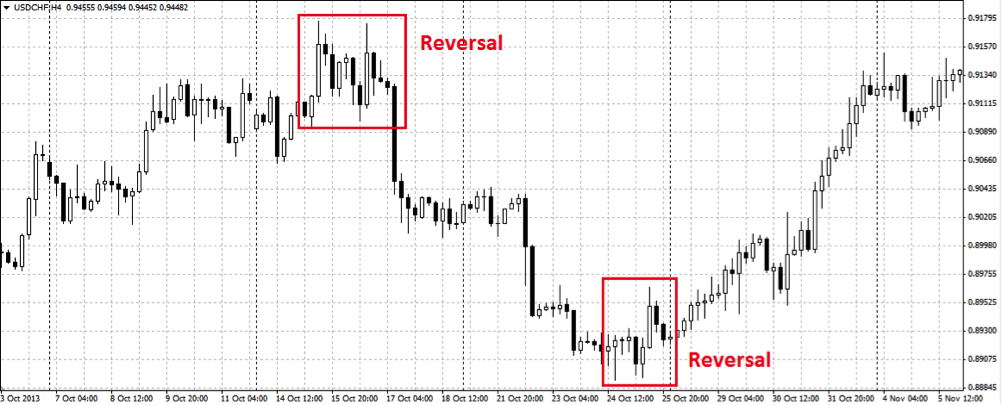
As you can see, a trend reversal has occurred twice. First trend reversal is bearish, the second – bullish. In any case, the trader had an opportunity to make some money in two cases. Read more about trend reversals here.
Ichimoku
Ichimoku trading system – is a trading strategy, the roots of which come to us from Japan. However, the system now profitably used by many traders, according to which the accuracy of its signal reaches about 70%.
In order to start trading on the system, you first need to download and install MetaTrader 4 trading terminal on your own PC, as well as install indicators and trading system template. After the indicators installed to the trading terminal and you applied to the chart pattern trading quotes, graphic asset makes such a shape.
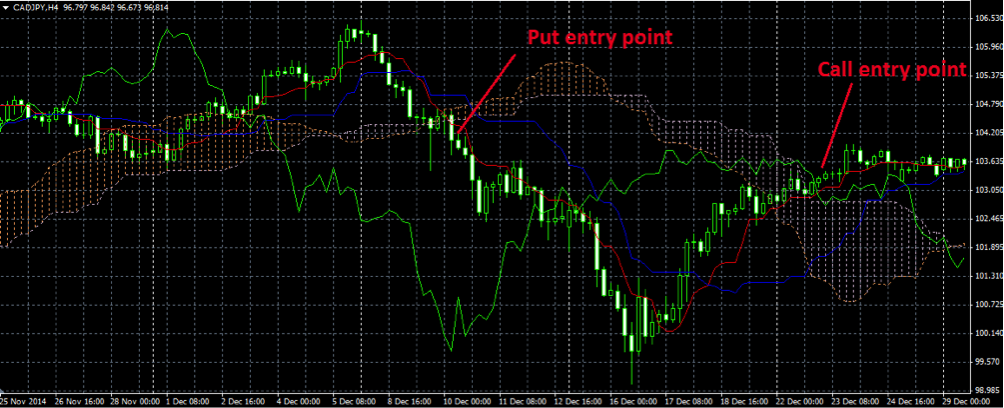
Only major cloud of Ichimoku Kinko Hyo indicator used in trading, finding where prices in the market means that there is the flat, enter into transactions is forbidden.
Once the candle at which the signal originated, closed and a new candle opened below Ichimoky cloud, enter into Put binary option/SELL contract. Once the candle at which the signal originated closed and a new candle opened above Ichimoku cloud, enter with Call binary option. If you prefer a more long-term trade, set Daily timeframe on a template system on the chart.
Doji
By itself, Doji candlestick pattern is not a reversal, but rather makes traders think that there is a balance of buyers and sellers in the market now, and it is unclear who will continue to push the market. This candle has a small body and long shadows. It shows that during the selected timeframe, the price made attempts to go up and down, but in the end, back to the opening level.
On the upward movement chart, Doji candle looks like this.
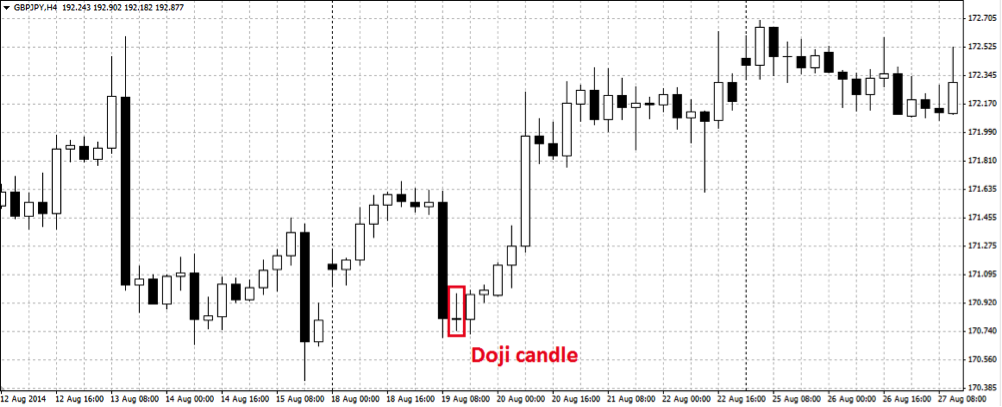
This candle may signal about trend reversal when after a rather strong price movements down after a bearish candle, which should at least be composed of half of the body with low shadows, Doji candle formed. This suggests that sellers are no longer able to raise the price and take a breather. Next candle answer to the question, which will tell us where the market will move on.
If the next candle is bearish, we miss such a signal, and if there is a big white candle is situated after Doji, it means that it’s time to enter the market with Call binary options buying. The answer to the question why we are trading only on a trend reversal, is that often such a move occurs more rapidly, and thus the chance to make a correct conclusion is higher. Therefore, if the next candle breaks the high of Doji, it is a signal for us to enter the market. The same situation may arise on an upward market. Thus, we need to wait for execution of the reverse conditions.
On the higher timeframe charts, tracing the emergence of Doji candle is fraught with the purchase or sale of options with long expiration, which will only make the long-term investment, keeping opened transaction a few days or weeks. Although, to confirm the use of such signals, these timeframes are useful.